Day 2
AT HOME
Reading Assignment: Read and Answer the questions below
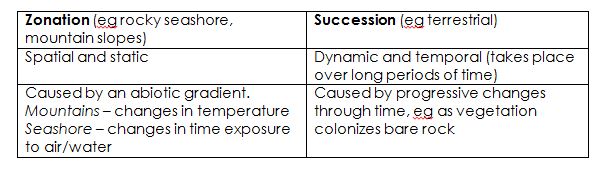
Distinguishing between succession and zonation
Succession is the process of change over time in an ecosystem involving pioneer, intermediate and climax communities.
Zonation refers to changes in community along an environmental gradient due to factors such as changes in altitude, latitude, tidal level or distance from shore (coverage by water).
Zonation
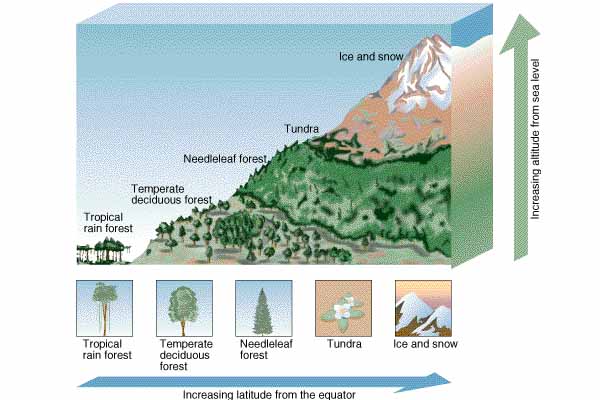
For each species, there is an ecological niche. That niche has boundary limits and outside these, the species cannot live. There are many abiotic factors that influence these limits. The most important ones on mountains are:
For each species, there is an ecological niche. That niche has boundary limits and outside these, the species cannot live. There are many abiotic factors that influence these limits. The most important ones on mountains are:
- Temperature - which decreases with increasing altitude and latitude
- Precipitation - on mountains, most rainfall is at middle altitudes so deciduous forest grows. Higher up, the air is too dry and cold for trees.
- Solar insolation - more intense at higher altitudes and plants have to adapt--often with red pigment in their leaves to protect themselves against too much insolation
- Soil type - in warmer zones, decomposition is faster so soils are deeper and more fertile. Higher up, decomposition is slow and soils tend to be acidic
- Interactions between species - competition may crowd out some species and grazing may alter plant composition. Mycorrhizal fungi may be very important in allowing trees to grow in some zones
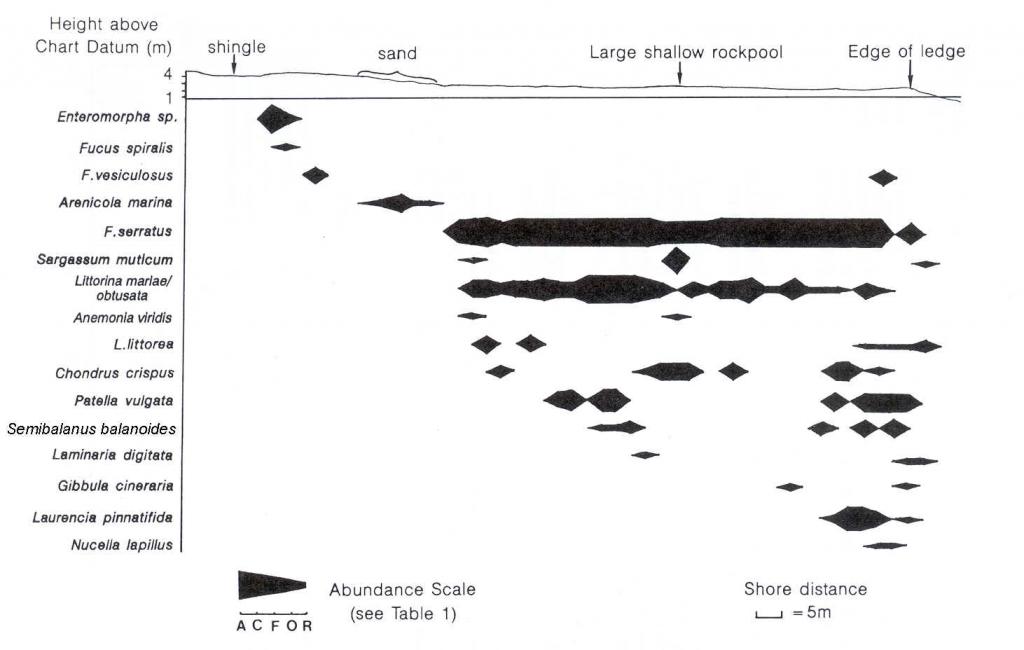
Graphical representation of zonation is often by a kite diagram where the width of the "kites" corresponds to the number of that species. The kite diagram below shows zonation of species on a rocky shore (ACFOR stands for Abundant, Common, Frequent, Occasional, Rare).
Questions:
1. In the kite diagram above, which species are most abundant in large, shallow rock pools? How do you know?
2. How would you classify F. vesiculosus on the Abundance Scale on the edge of the ledge?
1. In the kite diagram above, which species are most abundant in large, shallow rock pools? How do you know?
2. How would you classify F. vesiculosus on the Abundance Scale on the edge of the ledge?
Read the following article on zonation and succession on coastal sand dunes in New Zealand and answer the questions below.
Questions:
3. Distinguish between zonation and succession with respect to dune vegetation.
4. Why is understanding the principles of zonation and succession key to designing effective and appropriate dune restoration?
3. Distinguish between zonation and succession with respect to dune vegetation.
4. Why is understanding the principles of zonation and succession key to designing effective and appropriate dune restoration?
If you need to review r- and K- Strategies, watch the video below.
Questions:
5. Distinguish the roles of r and K selected species in succession
5. Distinguish the roles of r and K selected species in succession
IN CLASS
Succession Lab Raw Data
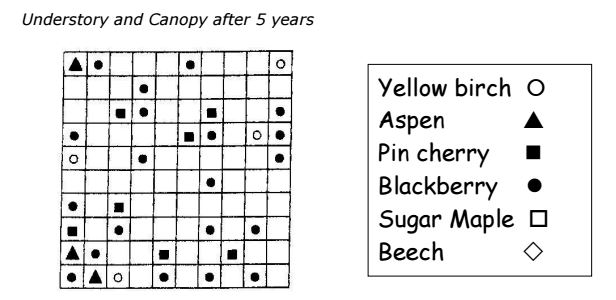
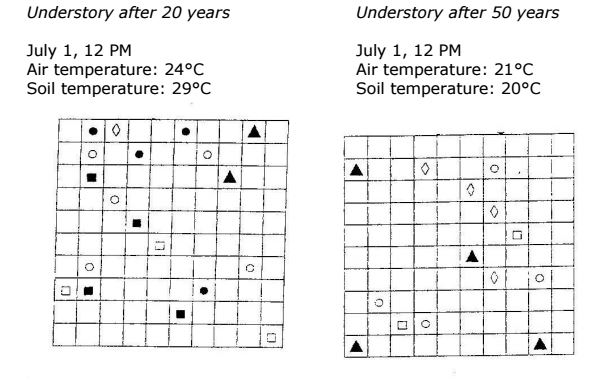
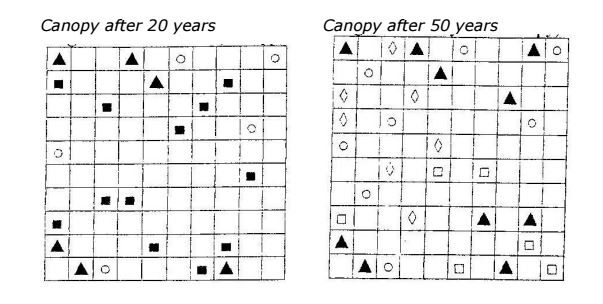
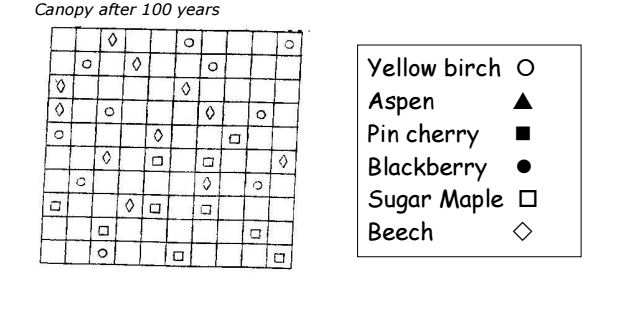
The following charts contain data collected in an abandoned hay field. After only 5 years, several types of trees have begun to grow where there was once only hay. The number and types of trees that grow in the field were counted 5, 20, 50 and 100 years after abandonment, in both the understory and the canopy.
The following charts contain data collected in an abandoned hay field. After only 5 years, several types of trees have begun to grow where there was once only hay. The number and types of trees that grow in the field were counted 5, 20, 50 and 100 years after abandonment, in both the understory and the canopy.
Data Analysis
- Create a data table for each data set (one for understory and one for canopy). The data table must show type and number of trees, abiotic data if given, and total percentage of each tree. Your data for year 5 will be the same in both tables.
- Using the data in the tables you just completed, construct two graphs. The first graph will show the changes in the percentage of each tree species in the understory from 5 to 50 years after the hay field was abandoned. The second graph will show the changes in the percentages of each tree species in the canopy from 5 to 100 years after the hay field was abandoned.
- Write a conclusion based on the information above
