Day 1
AT HOME
Reading Assignment
p. 114-124
Questions:
1. Explain the changes in energy flow, gross and net productivity, diversity and mineral cycling in different stages of succession.
2. Describe the main differences between succession and zonation.
3. Describe factors affecting the nature of climax communities.
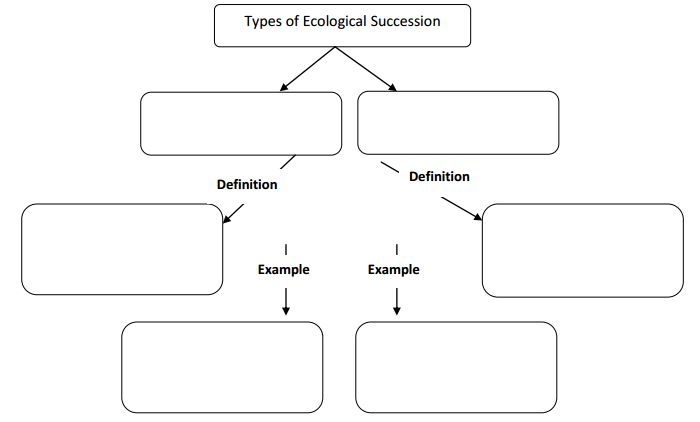
4. Complete the concept map below.
p. 114-124
Questions:
1. Explain the changes in energy flow, gross and net productivity, diversity and mineral cycling in different stages of succession.
2. Describe the main differences between succession and zonation.
3. Describe factors affecting the nature of climax communities.
4. Complete the concept map below.
IN CLASS
Succession Game
When everyone at your table has completed the reading and video, play the game. Each player will represent a different species. You will be simulating the effects of succession on a community and specific species.
Play the game for 15 minutes.
Rules:
After the Game: As a group, answer the following questions
When everyone at your table has completed the reading and video, play the game. Each player will represent a different species. You will be simulating the effects of succession on a community and specific species.
Play the game for 15 minutes.
Rules:
- Each player chooses a game piece and rolls the dice to see who moves first. The person who rolls the highest number goes first and turns continue in a clockwise rotation.
- To move through the game board, players roll a dice and follow the squares. When a player lands on a red square they draw a card. The card will designate the next move of EVERY player.
- After a card has been played, the next player starts his/her turn from their current position depending on what the last turn assigned. Some players may be affected in other players’ turns depending on the card.
- If two players end up on the same square, no matter the color, they will have to duel for survival. In a duel, the person who rolls the highest number wins. The winner moves up one space, the loser moves back one space.
After the Game: As a group, answer the following questions
- Give one example based on the cards when the success of one species positively affected the success of another species.
- Give one example based on the cards when the success of one species negatively affected the success of another species.
- Were all plants included in the climax community?
- Which plants succeeded in succession during your game?
- Do you think all of the plants would have been able to reach community climax, explain why or why not.
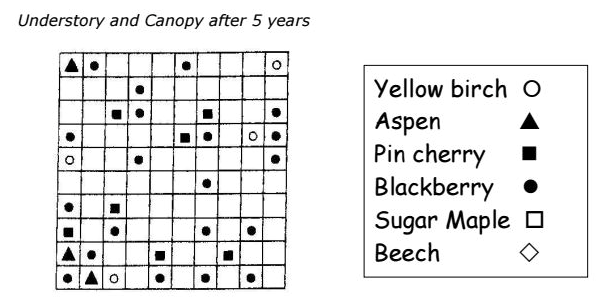
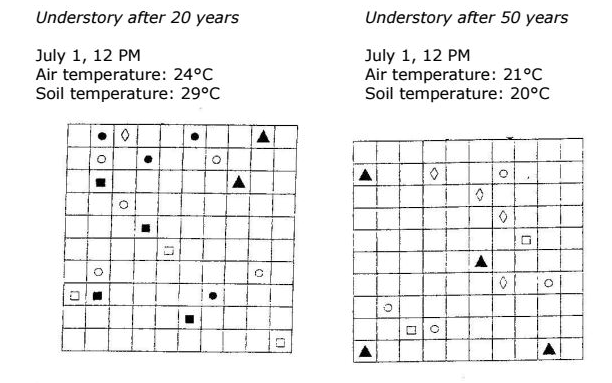
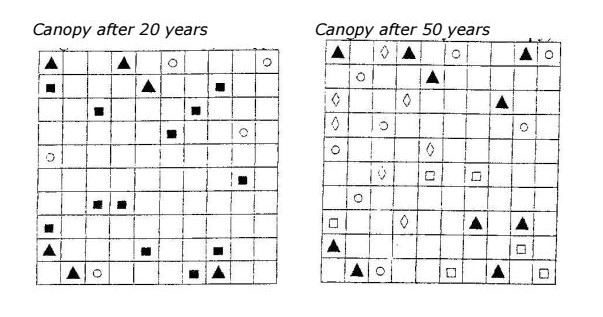
Succession Lab Raw Data
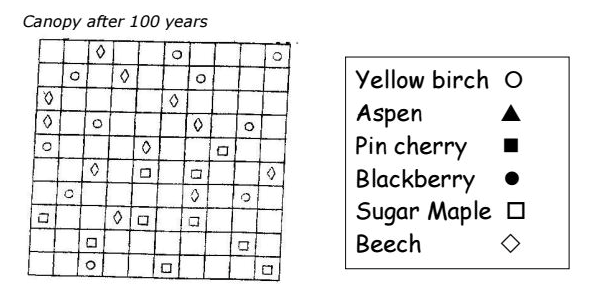
The following charts contain data collected in an abandoned hay field. After only 5 years, several types of trees have begun to grow where there was once only hay. The number and types of trees that grow in the field were counted 5, 20, 50 and 100 years after abandonment, in both the understory and the canopy.
The following charts contain data collected in an abandoned hay field. After only 5 years, several types of trees have begun to grow where there was once only hay. The number and types of trees that grow in the field were counted 5, 20, 50 and 100 years after abandonment, in both the understory and the canopy.
Data Analysis
- Create a data table for each data set (one for understory and one for canopy). The data table must show type and number of trees, abiotic data if given, and total percentage of each tree. You data for year 5 will be the same in each table.
- Using the data in the tables you just completed, construct two graphs. The first graph will show the changes in the percentage of each tree species in the understory from 5 to 50 years after the hay field was abandoned. The second graph will show the changes in the percentages of each tree species in the canopy from 5 to 100 years after the hay field was abandoned.
- Write a conclusion based on the information above
